
Quick answer
The report gives a narrow view. It is not the full account review.
Open the Local Services Ads lead inbox, choose the menu at the top, and select Reports. The native Reports tab is limited: it shows spend, charged leads, impressions, top impression rate, absolute top impression rate, and a charged-leads graph. Use the Leads tab for credit visibility and Advantage when you need the full account picture in one place.
What this covers
- Find the reportOpen your Local Services Ads inbox, use the top menu, and choose Reports.
- Read the numbersReview total lead spend, charged leads, ad impressions, top impression rate, absolute top impression rate, and the charged-leads chart.
- Decide what to check nextUse the limited report view as the starting point, then review credits, calls, messages, lead quality, and account health outside the Reports tab.
What to review before acting
Your Local Services Ads report is the first place to check when spend, charged leads, impressions, or search-position visibility do not match what the team expected.
Treat the report as the starting screen, not the full operating review. The next step is deciding whether the movement came from budget, lead type, response, lead quality, service area, credits, or account status.
5K client calls generated
PrimeLSA has helped generate thousands of Local Services Ads calls for client accounts.
Transparent account communication
Clear communication and account review help teams understand what changed before they act.
Advantage review path
Readers can move from public education into account-specific review through Advantage.
How to view your Local Services Ads report
To view your Google Local Services Ads report, open the Local Services Ads inbox, click the menu at the top, and select Reports.
Before you read the numbers, confirm you are looking at the correct business, service category, and date range. Many reporting mistakes start with the wrong account or a period that does not match the business question.
| Step | Action | What to confirm |
|---|---|---|
| 1 | Sign in to the Local Services Ads inbox. | You are using the correct Google account and business profile. |
| 2 | Open the menu at the top. | You are in the Local Services Ads experience, not a standard Google Ads campaign view. |
| 3 | Click Reports. | The reporting dashboard loads for the selected business. |
| 4 | Set the report period. | The date range matches the week, month, or comparison window you want to review. |
| 5 | Review spend, charged leads, impressions, and search-position rates. | The next action is based on evidence, not a single headline number. |
Save the report before the Google Ads migration
Migration note reviewed July 31, 2026: Google says previous LSA campaign performance reports will not carry into the migrated Google Ads campaign and the old dashboard becomes inaccessible after migration. Use the LSA report archive guide to save useful date ranges, record account context, and test each file before the account deadline.
Google documents the current path as Inbox > Menu > Reports but does not publish one universal export-button label for every pre-migration account view. Use the download, export, print, or manual-save control available in the account and preserve structured rows when offered.
What the native LSA report shows
The native Reports tab is useful, but narrow. It gives a quick overview of spend, charged leads, impressions, and search-position visibility for the selected date range.
It does not show everything an operator or agency needs to diagnose the account. Treat it as the first screen, not the full review.
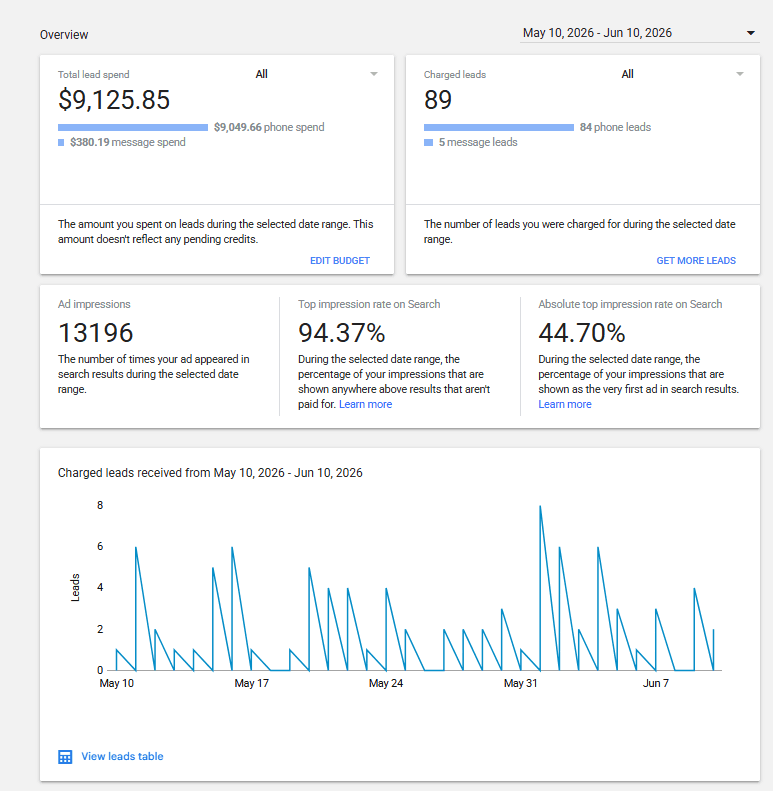
| Report area | What to look at | Why it matters |
|---|---|---|
| Total lead spend | Total spend during the selected date range, often split by phone and message spend. | This is the starting spend number, but it does not include pending credits. |
| Charged leads | The number of leads charged during the selected date range, often split by phone and message leads. | This is the base count for report-level CPL review. |
| Ad impressions | How many times the ad appeared in search results during the selected date range. | A lead drop with impressions still present can point to conversion or response issues. |
| Top impression rate on Search | The percentage of impressions shown above unpaid results. | This helps review visible search placement, not lead quality. |
| Absolute top impression rate on Search | The percentage of impressions shown as the first ad in search results. | This helps separate top visibility from first-position visibility. |
| Charged-leads graph | A chart of charged leads received over the selected date range. | The chart shows charged lead timing only. It does not diagnose why leads changed. |
What the report does not explain by itself
The report gives you the numbers. It does not always explain the operating cause behind those numbers.
| Native report item | What it tells you | What it does not tell you | Next review |
|---|---|---|---|
| Charged leads | How many leads were charged. | Whether those leads were qualified, answered, or booked. | Open the lead list and review call or message details. |
| Total lead spend | How much lead spend occurred in the selected period. | Whether pending credits will change the true cost picture. | Open the Leads tab and review expected credits and charge status. |
| Phone and message split | How spend and charged leads break down by lead type. | Whether the team handled calls and messages well. | Review missed calls, reply timing, and follow-up. |
| Impression rates | How often the ad appeared above unpaid results or as the first ad. | Whether the leads were useful, answered, booked, or credited. | Compare visibility with lead quality and response. |
| Charged-leads graph | When charged leads arrived during the selected period. | Why leads rose or fell on those days. | Review budget, service area, competition, calls, messages, and account health. |
| Date range totals | What happened in a selected window. | Whether the change came from seasonality, market demand, or account health. | Compare previous periods and recent account changes. |
Where to view lead credits
Lead credits do not belong to the Reports tab view. To review credits, open the Leads tab and look for the credit banner and charge status details.
This matters because the report spend card says lead spend does not reflect pending credits. If you judge CPL only from the Reports tab, you can overstate the real cost before credits settle.
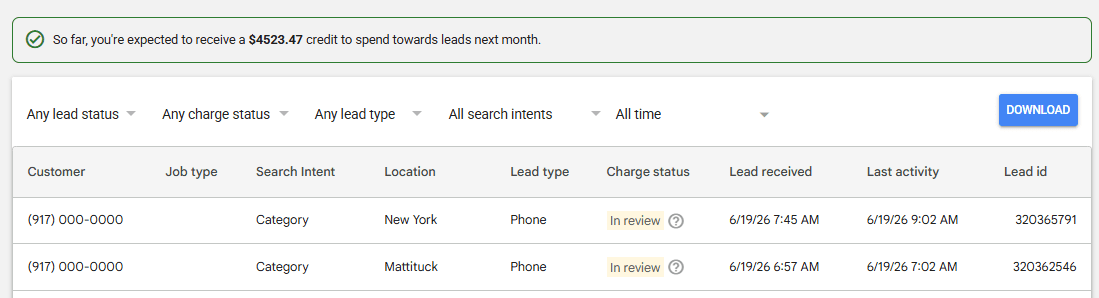
| Question | Where to check | Why |
|---|---|---|
| Pending or expected credits | Leads tab | The Reports tab spend card does not reflect pending credits. |
| Charge status | Leads tab | Lead rows show whether a lead is in review, charged, or credited. |
| Real CPL after credits | Reports plus Leads tab | You need both spend and credit context before judging cost. |
| Lead quality | Leads tab, calls, messages, and intake notes | Reports does not explain whether charged leads were useful. |
LSA report reading checklist
Use this checklist before you change budget, bid mode, service categories, or intake staffing.
- Confirm the date range and compare it with the previous matching period.
- Review total lead spend and remember that it does not reflect pending credits.
- Review charged leads by phone and message lead type.
- Check ad impressions, top impression rate, and absolute top impression rate.
- Use the Leads tab to separate charged leads from expected or credited leads.
- Review the individual lead list, not only the Reports tab totals.
- Flag missed calls, slow message replies, bad-fit leads, and unbooked qualified leads.
- Compare spend pace against average weekly budget and monthly max.
- Check account alerts, billing status, service area, categories, hours, and verification status.
- Document the next review action before making account edits.
Metric-to-action matrix
This matrix turns report movement into practical next checks.
| Report signal | What it may mean | What to check next |
|---|---|---|
| Charged leads dropped | Visibility, demand, budget, account status, or lead type may have changed. | Impressions, top impression rates, account alerts, service area, hours, reviews, missed calls, and messages. |
| Spend rose but charged leads did not | Lead price or lead type mix may have shifted. | Phone/message spend split, charged leads, credits in the Leads tab, and budget pace. |
| Impressions dropped | Search demand, eligibility, service area, or account status may have moved. | Account status, verification, categories, service area, business hours, and market demand. |
| Top impression rate dropped | The ad may be appearing less often above unpaid results. | Bid mode, budget support, reviews, profile quality, responsiveness, and local competition. |
| Absolute top impression rate dropped | The ad may still appear above unpaid results but less often as the first ad. | Market pressure, bid posture, budget, account status, and profile strength. |
| Credits expected | Reported spend may not reflect final cost yet. | Leads tab credit banner, charge status, lead quality, and credit timing. |
| Budget spent early | Lead volume or price moved faster than planned. | Average weekly budget, monthly max, lead target, bid mode, and high-cost lead groups. |
Weekly LSA report template for agencies and operators
For agencies, franchises, and multi-location operators, a weekly report should make the next decision clear. Do not send a pile of numbers without a short operating note.
| Weekly section | Include | Decision it supports |
|---|---|---|
| Summary | Leads, spend, CPL, credits, bookings, and one sentence on what changed. | Whether the account needs review this week. |
| Reports tab | Total lead spend, charged leads, impressions, top impression rate, absolute top impression rate, and charged-leads chart notes. | Whether the native report changed this week. |
| Leads tab | Expected credits, charge status, lead rows, and lead type details. | Whether reported spend needs credit context. |
| Lead quality | Poor-fit, credited, and qualified leads from the lead list and intake notes. | Whether the account is buying useful conversations. |
| Response | Missed calls, returned calls, message response, and follow-up notes. | Whether intake is protecting the paid leads. |
| Budget | Weekly budget, monthly max, spend pace, and budget spent context. | Whether budget is constraining or wasteful. |
| Next action | One to three specific checks or changes to review. | What the owner, manager, or agency should do next. |
Troubleshooting flow when report numbers look wrong
If the report looks wrong, slow down before changing several settings at once.
| Symptom | First check | Second check | Escalation path |
|---|---|---|---|
| No reports visible | Correct Google account and business selection. | LSA inbox access and permissions. | Ask the account owner or manager to confirm access. |
| Lead count looks too low | Date range and report filters. | Phone and message charged-lead split. | Compare with the Leads tab and previous period. |
| Spend does not match expectations | Total lead spend and pending credits. | Leads tab credit banner and charge status. | Reconcile against invoice and selected reporting period. |
| Bookings look incomplete | Whether booked details are being marked consistently. | Country and account eligibility for booking features. | Use an internal booking log for comparison. |
| Agency cannot consolidate reports | Per-account access. | Manager account structure. | Standardize the client reporting process and confirm each account is visible. |
Access and visibility checklist
Report visibility usually comes down to account access, account selection, or the path used to open reporting.
| Check | Why it matters |
|---|---|
| Correct Google account | The wrong login can show a different business or no LSA account. |
| Correct business selected | Multi-location and agency users can read the wrong account by accident. |
| LSA inbox path | The report path starts in the Local Services Ads inbox, not a standard search campaign report. |
| User permissions | Users may see fewer controls if they do not have the right account access. |
| Leads tab access | Credit and charge-status context appears in the Leads tab, not only in Reports. |
| Partner or affiliate setup | Some accounts managed through partners may expose a different path or limited controls. |
| Consistent report process | Multi-account operators need a repeatable process for account selection, date ranges, lead types, credits, and booked outcome notes. |
How Advantage fits after the native report
The native Google report should remain the source for Google-reported report metrics. Advantage by PrimeLSA fits after that, when the team needs to connect the limited report view to calls, messages, lead quality, credits, budget, account health, and next actions.
If call leads look weak, review Google LSA call analysis. If message leads are slow to convert, review Google LSA auto reply. If lead quality or credits changed, review Google LSA lead feedback.
When the report shows a sharper movement, compare it with problem guides such as LSA leads suddenly stopped and LSA cost per lead increased. Advantage helps organize what the native Reports tab leaves out, but it does not change budgets or reports, submit lead feedback, send messages, or edit account settings for you.
Final takeaways
Start in the Local Services Ads inbox, open Reports, and choose the right date range. Read total lead spend, charged leads, impressions, top impression rate, absolute top impression rate, and the charged-leads graph.
Then open the Leads tab for credit and charge-status context. After that, review the operating layer: calls, messages, lead quality, budget pace, service area, category fit, and account health. The native report shows a narrow slice. The review decides what to do next.
Editorial note
Written by Arthur Z and last updated June 18, 2026. PrimeLSA keeps public guidance practical, Google Local Services Ads-specific, and connected to real account review.